Three ad channels, three different leaders
A July review of Facebook, AppLovin / Axon, and Google shows why traffic size alone is not enough to judge channel value.

Introduction
Stream and Fintouch are two ecommerce growth products that have served more than 10,000 ecommerce sellers. Brands in different categories and at different stages often run into similar questions. A fluctuation that looks specific to one seller can reveal a shared pattern when it is viewed across a broader sample and a longer period. Each seller knows its own business best, while a wider set of operating experiences helps turn scattered observations into trends and growth ideas that the industry can learn from.
That is why we started the Market Data Review series. We want to turn the observations and questions accumulated through our work into practical industry knowledge for more ecommerce sellers. Every analysis in this series uses anonymized, aggregated data. It does not show brand identities, operating scale, or any information that could identify an individual customer.
As the opening article in the series, this review looks at July ecommerce advertising performance through three lenses: traffic, add-to-cart rate, and average order value. We will continue to explore channel performance by category and more specific operating questions. If there is a topic you would like us to investigate, we would be glad to hear from you.
The headline: three metrics, three different leaders
The most interesting part of July was not one channel leading across every metric. Instead, each of the three metrics had a different leader: Facebook had the largest traffic scale, AppLovin / Axon had the highest add-to-cart rate, and Google had the highest average order value.
Across the three main channels, July on-site traffic fell 14.2% from June. The channels did not all decline together. The main reason was a simultaneous pullback from Facebook and AppLovin / Axon, while Google was essentially flat.
This is a useful reminder that channel quality cannot be judged by traffic volume alone. Traffic scale, the share of visitors who add to cart, and the average value of completed orders answer three different questions. Reading them together gives a more complete view of channel performance.
Start with traffic scale: Facebook remains the base, while AppLovin is now second
One notable change is that, among the three main channels identifiable in this review, AppLovin / Axon has moved ahead of Google in on-site traffic and is now the second-largest source after Facebook. It was also the channel with the clearest July pullback.
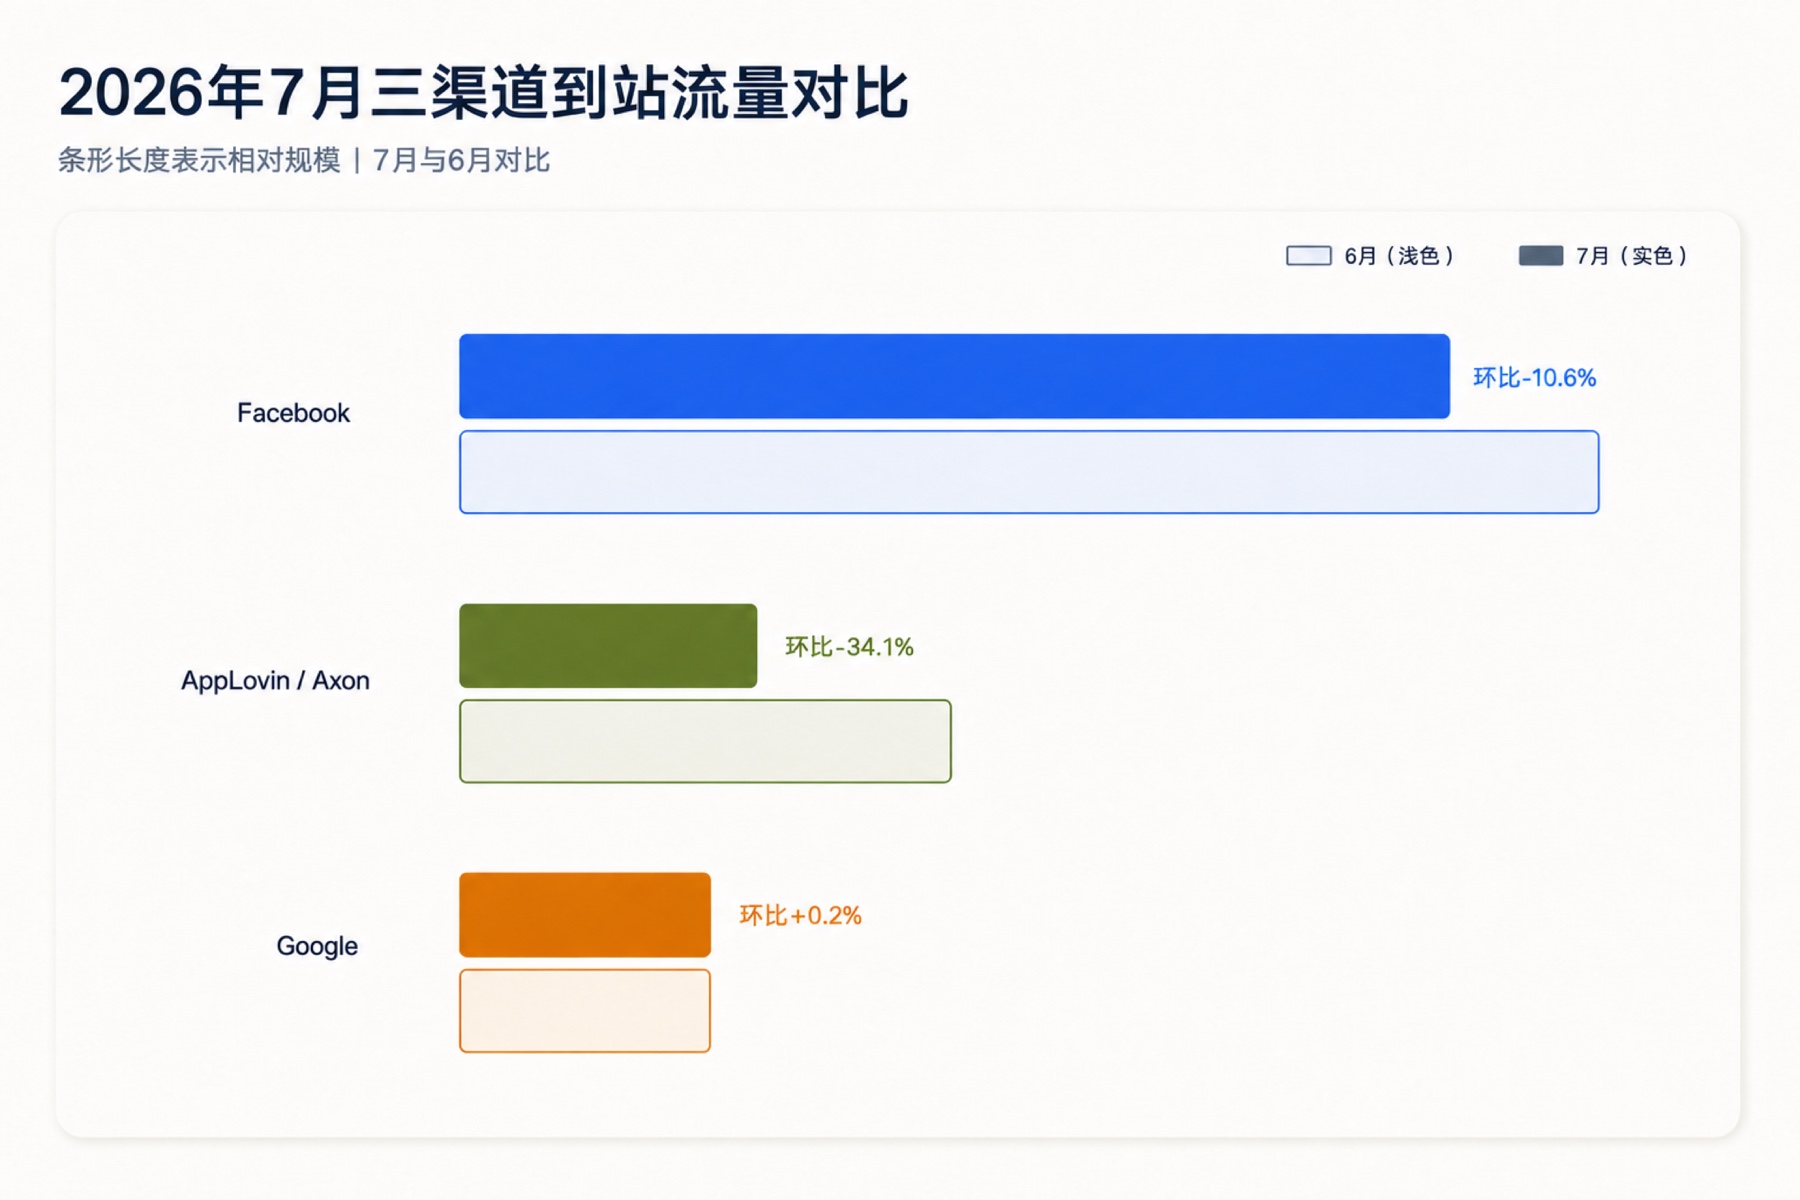
Facebook remained the largest on-site traffic source in July. It was down 10.6% from June, but its traffic scale was still clearly higher than the other two channels. Its position as the core traffic source did not change.
AppLovin / Axon ranked second in on-site traffic, but declined 34.1% from June. Its pullback at the same time as Facebook explains much of the overall July decline.
Google was the most stable channel in July. It was up 0.2% from June, which is effectively flat.
Then look at the traffic trend index: AppLovin stayed high, but cooled in July
To see whether each channel was expanding or contracting over the six-month period, we set each channel's average daily traffic in February to 100. An index of 200 means the channel reached twice its own February level; an index of 50 means it fell to half of that level.
The easiest mistake here is to read a high index as a large traffic volume. The index only shows how much a channel has grown compared with its own past. It is not designed to compare the actual size of two different channels.
Imagine a small shop growing from 100 visitors a day to 250. Its index is 250. A much larger shop could fall from 1,000 visitors a day to 900, giving it an index of 90. The small shop has the higher index, but the large shop still receives more visitors.
The chart uses a 7-day moving average to reduce the impact of single-day swings. It is therefore best for reading the broader direction, not the performance of one specific day.
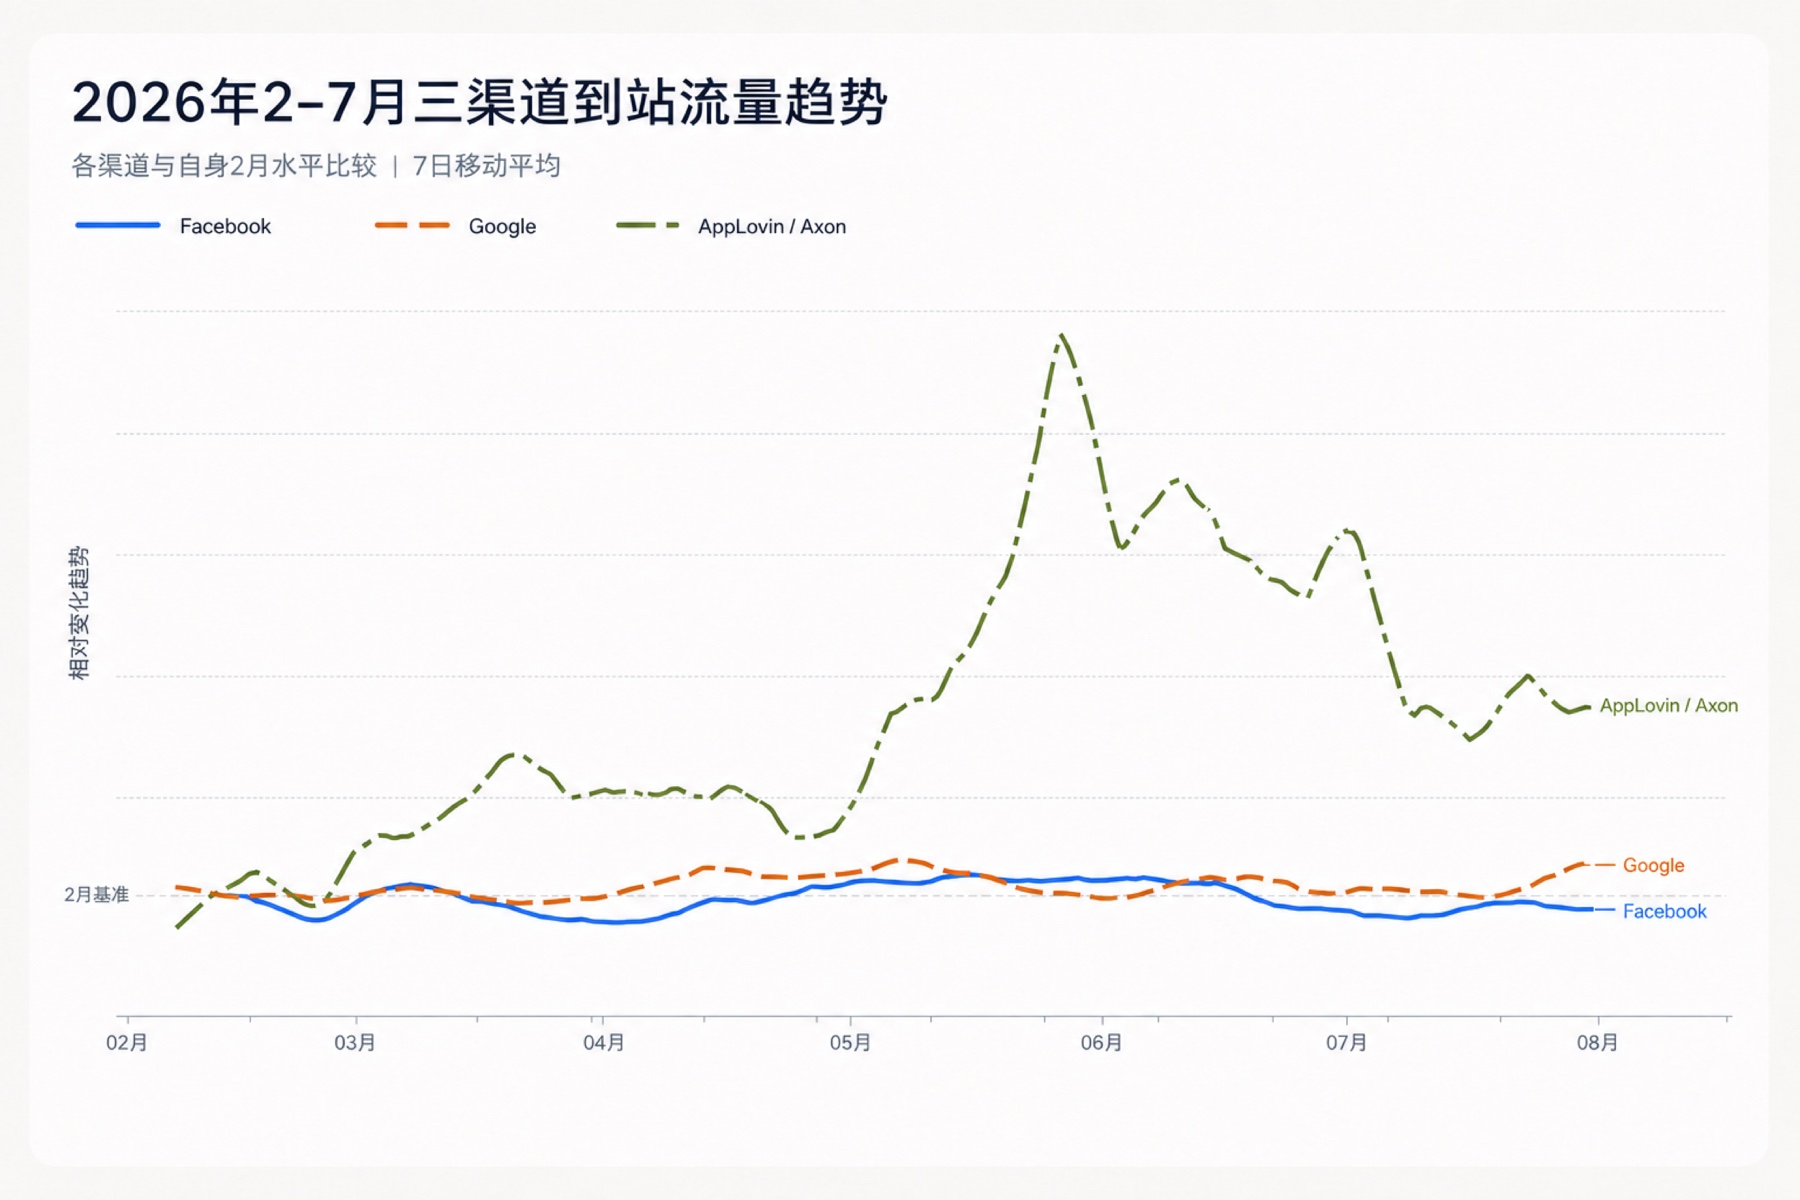
AppLovin / Axon is a good example. Its July traffic was still more than twice its own February level, but that does not mean it had overtaken Facebook. The traffic-scale comparison above shows that Facebook still brought substantially more visitors.
The trend also matters. AppLovin / Axon grew quickly in late May, stayed high in June, and had clearly cooled by July. The most accurate description is not that it was still accelerating, but that it remained high compared with February while pulling back noticeably from June.
Facebook was 11.3% below its February level in July, while Google was slightly above February. Reading this trend chart together with the scale comparison helps answer both questions: how large is the channel, and is it getting larger or smaller?
Add-to-cart rate: AppLovin / Axon had the highest share, but not the largest scale
The add-to-cart rate shows how many people who arrived from a channel continued to add a product to their cart. It is different from traffic scale. A channel can bring many visitors without having the highest add-to-cart share, while a smaller channel can show stronger intent to continue shopping.
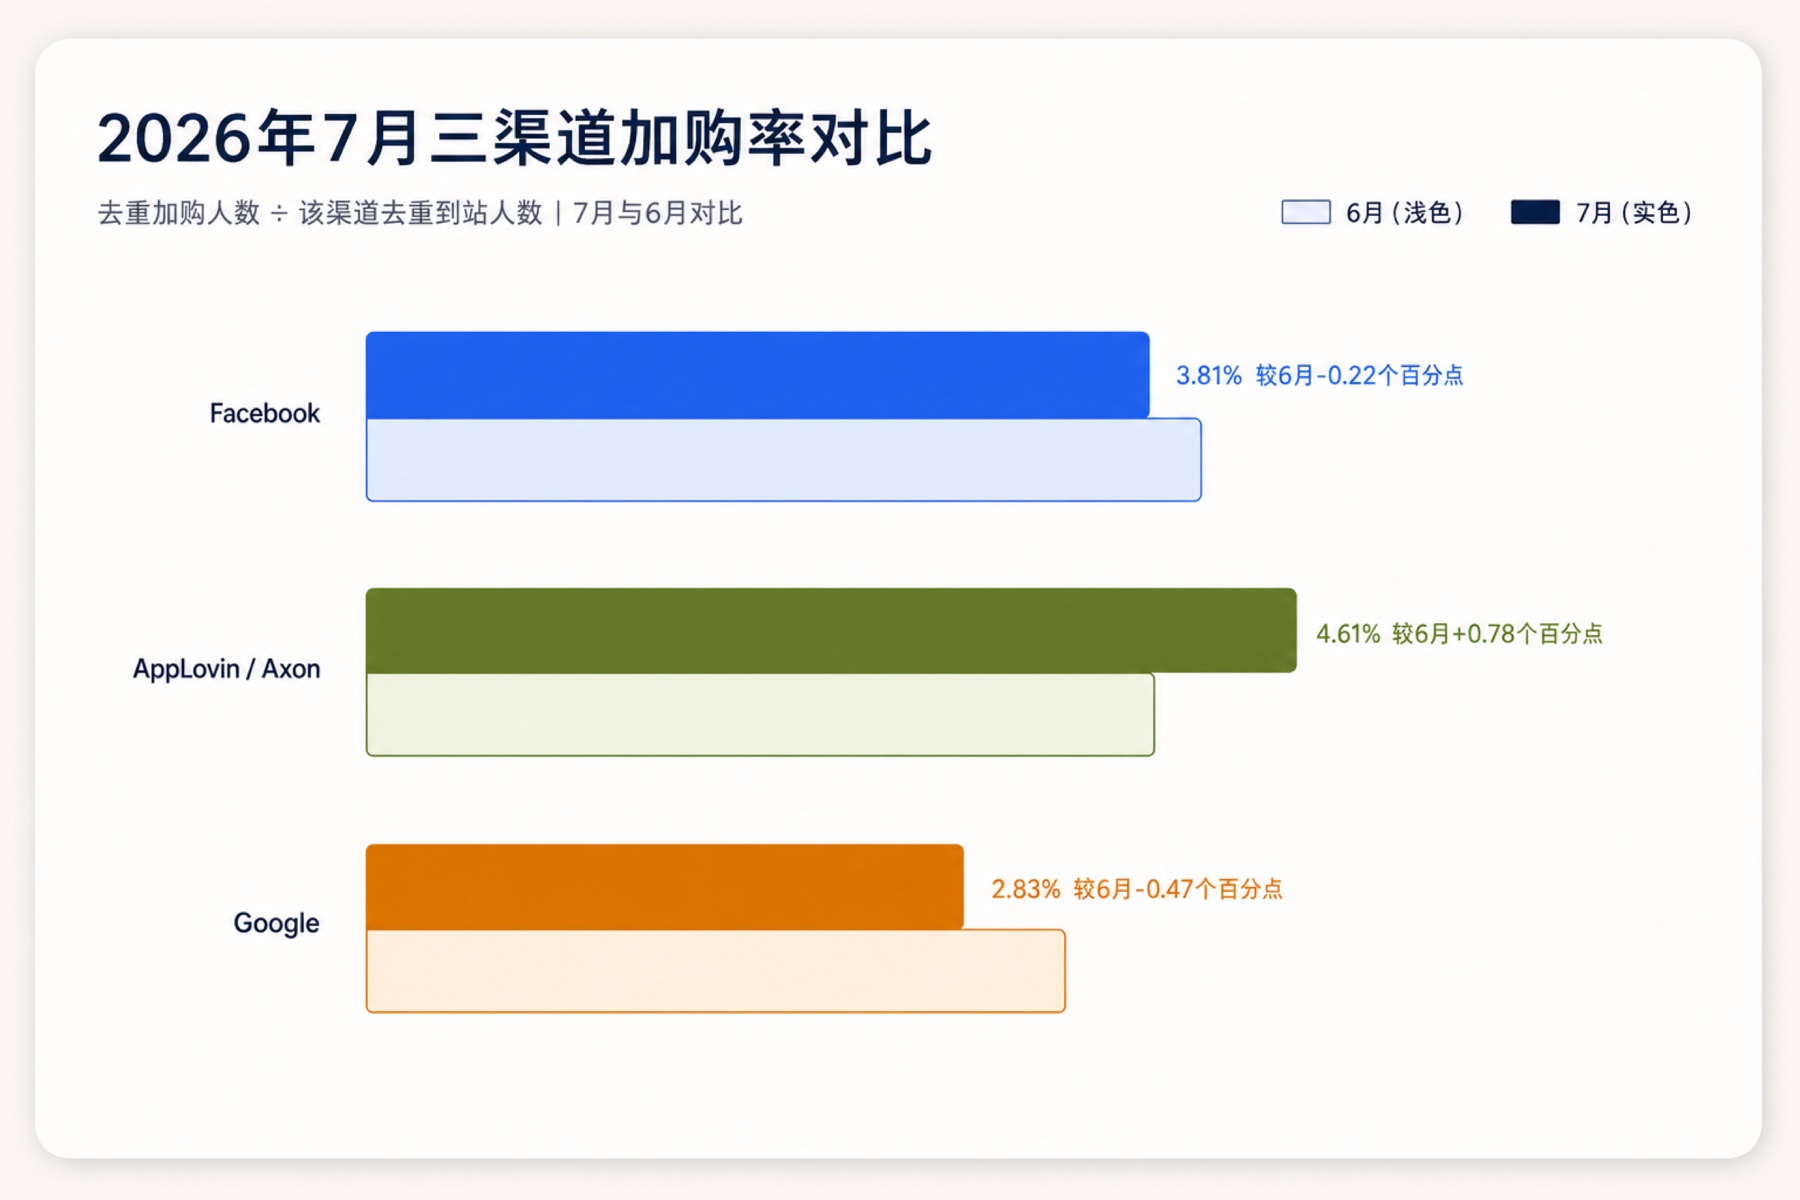
AppLovin / Axon had a July add-to-cart rate of 4.61%, up 0.78 percentage points from June and the highest of the three channels. In other words, its traffic became smaller, but the share of visitors moving to the cart step improved.
If you are deciding whether that signal is enough to justify a test, use five checks to see whether your ecommerce store is ready for AppLovin.
Facebook's July add-to-cart rate was 3.81%, down 0.22 percentage points from June. Because Facebook has the largest traffic base, even a small rate change can affect the overall add-to-cart picture.
Google's July add-to-cart rate was 2.83%, down 0.47 percentage points from June and the lowest of the three. That does not automatically mean Google traffic has lower order value, as the average order value comparison shows next.
Average order value: Google led, and all three channels improved in July
Average order value is the average amount in each completed order. This comparison uses USD orders only, so every amount in the chart is in US dollars. Average order value is the only metric in this article that displays a specific monetary amount. Absolute traffic volumes are intentionally omitted from the charts.
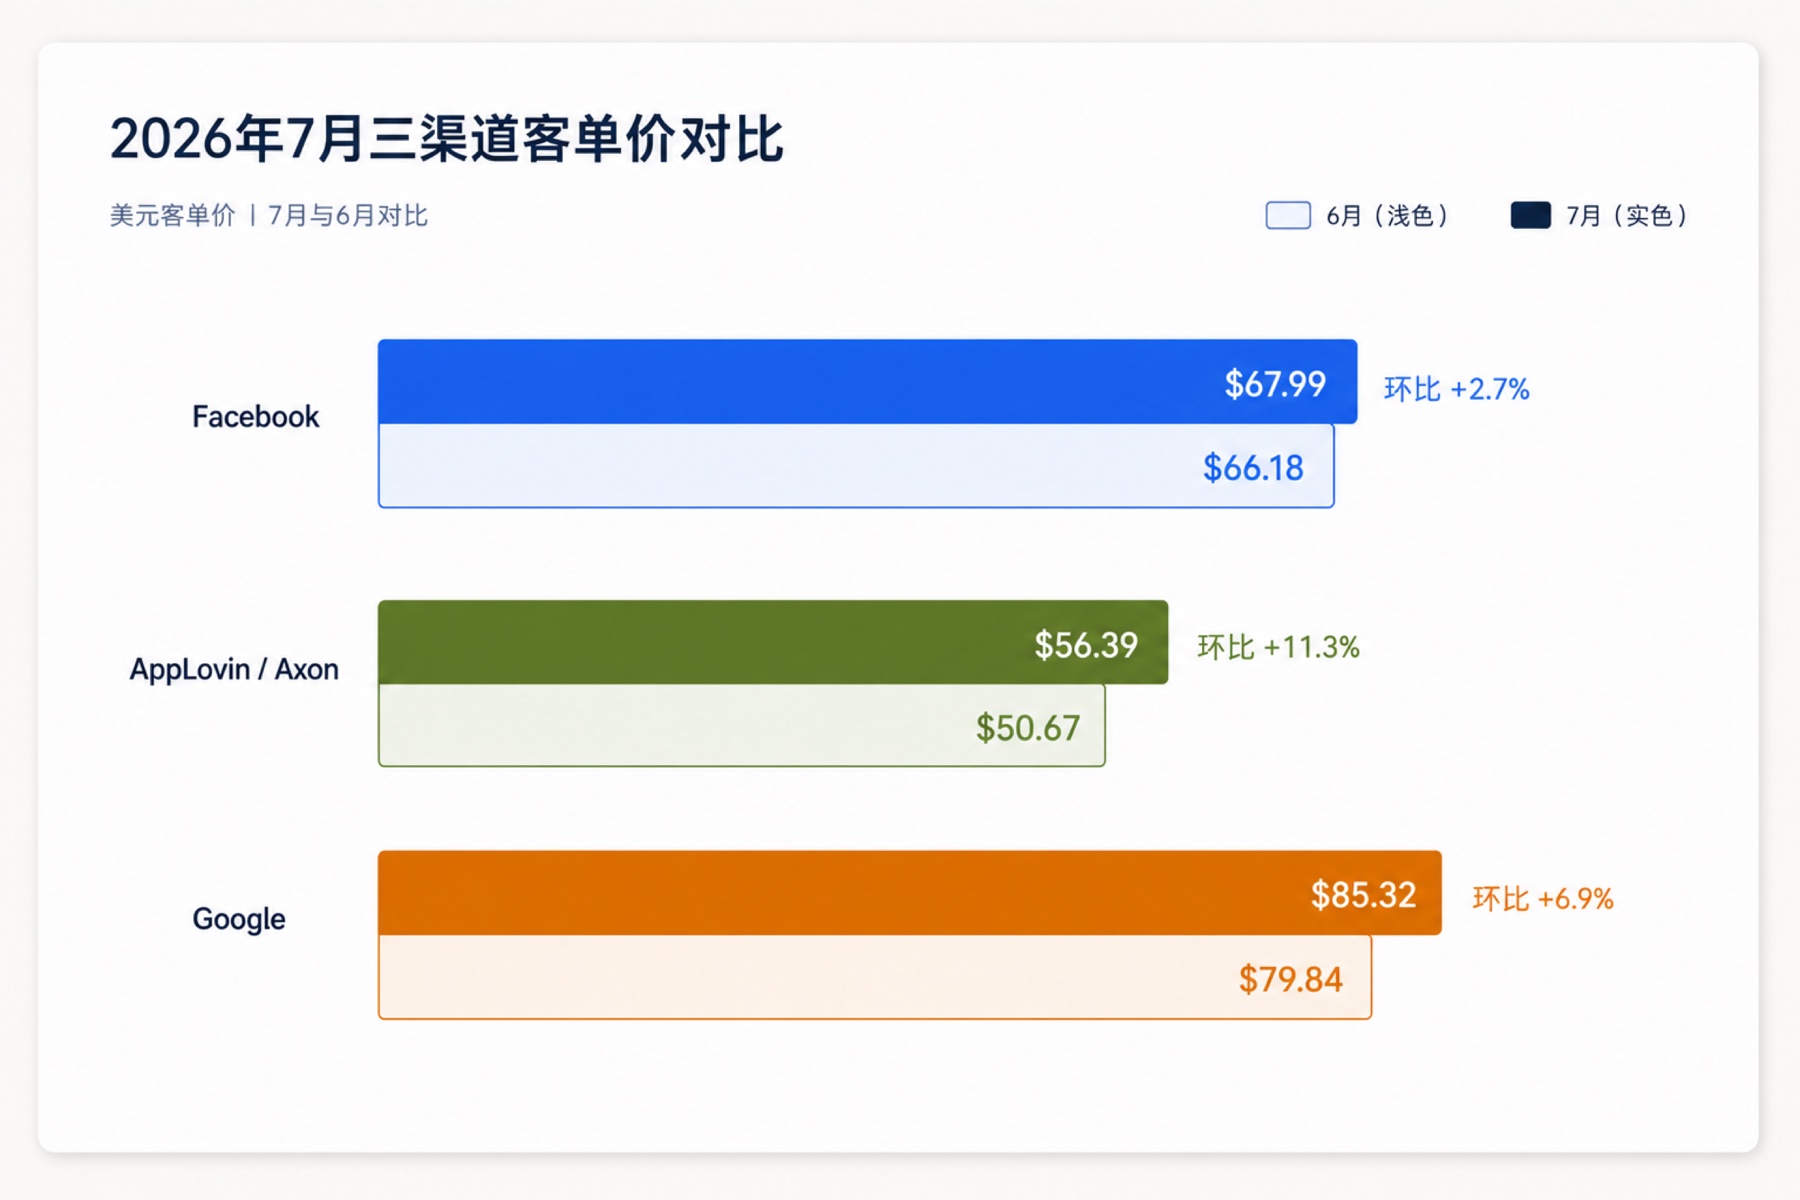
Google had the highest July average order value at $85.32, up 6.9% from $79.84 in June. Its July average order value was about 25.5% higher than Facebook's and about 51.3% higher than AppLovin / Axon's. This means Google had a lower add-to-cart rate, but the orders that did come through were worth more on average.
Facebook's July average order value was $67.99, up 2.7% from $66.18 in June. Its strength is not the most expensive single order. It combines a relatively strong order value with the largest traffic scale.
AppLovin / Axon's July average order value was $56.39, up 11.3% from $50.67 in June, the largest increase among the three channels. Its July signal was therefore positive on both add-to-cart intent and order value, even though its absolute order value remained below the other two channels.
Three practical takeaways for ecommerce sellers
- Repair the path from arrival to cart on Facebook first. Facebook is the traffic base, so even a small decline in add-to-cart rate can matter at the overall level. Start by checking whether the ad promise, landing page, and product page tell the same story.
- Raise Google's add-to-cart rate without giving up order value. Google users produced the highest average order value, which points to valuable traffic potential. Focus on removing friction between the landing page and the cart instead of relying only on lower prices to create more carts.
- Keep watching what happens after the cart on AppLovin / Axon. Its add-to-cart rate and average order value both improved, but its traffic cooled. The next question is how many of those cart users continue to checkout and complete an order.
Conclusion
This review is only a first look. Ecommerce seller operations offer many more questions worth tracking, and the Market Data Review series will continue. If you are running an ecommerce business, we would be happy to hear what you are watching and what questions you are trying to answer. Together, we can turn more individual observations into trends and methods worth following over time.
This article describes differences in channel behavior. It is not a report of advertising spend and cannot by itself determine CPM, CPC, complete purchase conversion, or ROI.