Independence Day review: Did ecommerce conversion really get worse?
A comparison of apparel stores around Independence Day in 2025 and 2026 shows that this year's order decline began with less traffic and a weaker visit-to-cart step, not a collapse across every conversion stage.
Many sellers have been saying the same thing: Independence Day in 2026 felt nothing like Independence Day in 2025.
Some say traffic never arrived. Others say conversion got worse. Does the data support that feeling?
We sampled 10 million monthly unique visitors from Stream's aggregate data and compared the 30 days before and after Independence Day in both 2025 and 2026 to review what actually happened to ecommerce conversion.
The short answer: sellers were right, and the data is even harsher than the feeling.
First, the data scope
To make the two years comparable, we focused on apparel. It provides a large data volume and includes products both with and without a holiday angle, making it a useful category for observing seasonal performance.
The approach is straightforward: sample 10 million unique visitors from apparel stores, then observe their subsequent add-to-cart and purchase behavior.
Seller impression one: “The post-holiday drop was brutal”: correct, but the decline started before the holiday
Start with the clearest comparison: the 30 days after Independence Day versus the 30 days before it.
| 2025 | 2026 | |
|---|---|---|
| Sum of daily unique visitors | +18.9% | -11.4% |
| Purchasing users | +13.2% | -13.5% |
| Cart → order (before → after) | 7.96% → 7.39% (down) | 9.49% → 9.66% (up) |
Last year, volume grew after the holiday. This year, both traffic and orders fell. The same group of stores and the same holiday produced mirror-image results across the two years. The data fully supports sellers who felt that this year was completely different.
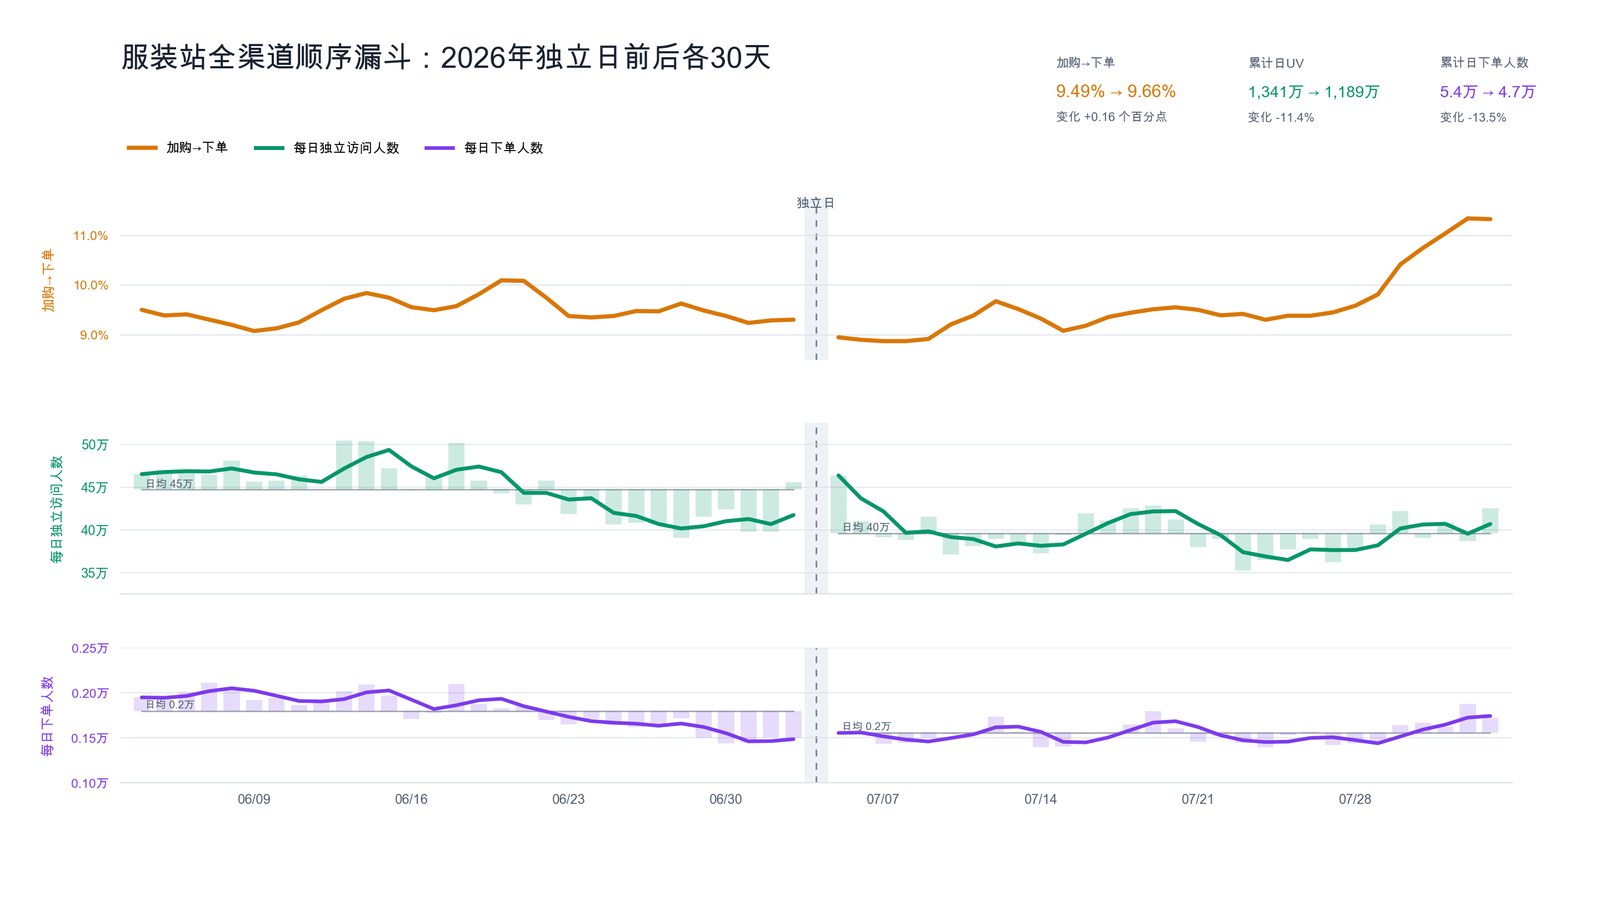
But simply saying “performance fell after the holiday” understates what happened. The daily 2026 trend shows that the real turning point came a full two weeks before July 4:
- Three weeks before the holiday (days 15 to 21 before Independence Day): traffic was still near the high point for the entire observation window.
- The final week before the holiday (days 1 to 7 before Independence Day): average daily UV had already fallen 13.8% from that high, while average daily purchasing users were down 20.6%.
Traffic and orders were already weakening as the market entered the final two weeks before Independence Day. July 4 was not the turning point. It was merely a date inside an existing decline.
That is why so many sellers felt caught off guard. By the time the holiday-day numbers looked wrong and they reduced spend, the market had already been cooling for two weeks.
Seller impression two: “Conversion got worse this year”: only half right
This is the second common conclusion: fewer orders must mean a conversion problem.
The data gives a more nuanced answer. Across the 30 days after Independence Day in 2026:
- Visit → cart: 4.24% → 4.07% (down 0.18 percentage points)
- Cart → order: 9.49% → 9.66% (up 0.16 percentage points)
- Final visit → order: 0.403% → 0.393%, a slight decline
Look closely: people who added to cart this year were actually more likely to complete a purchase. Orders fell first because total traffic contracted, and second because more visitors never reached the cart. The break was between the visit and the cart, not after the cart.
That makes two common readings incomplete:
- Looking only at purchasing users puts all the blame on “worse conversion.”
- Looking only at cart → order creates the false impression that “conversion has recovered.”
There was another misleading signal worth watching. In the fourth week after the holiday (days 22 to 30), cart → order rose to 10.55%, which looked like a recovery. Yet visit → cart was still at a low of 3.84%, and average daily purchasing users remained 17.1% below the mid-June peak.
The remaining cart users becoming easier to convert does not mean the business recovered. The traffic pool had shrunk, leaving a higher concentration of people with the strongest purchase intent. It was survivor selection, not a rebound.
Why did 2025 feel so smooth?
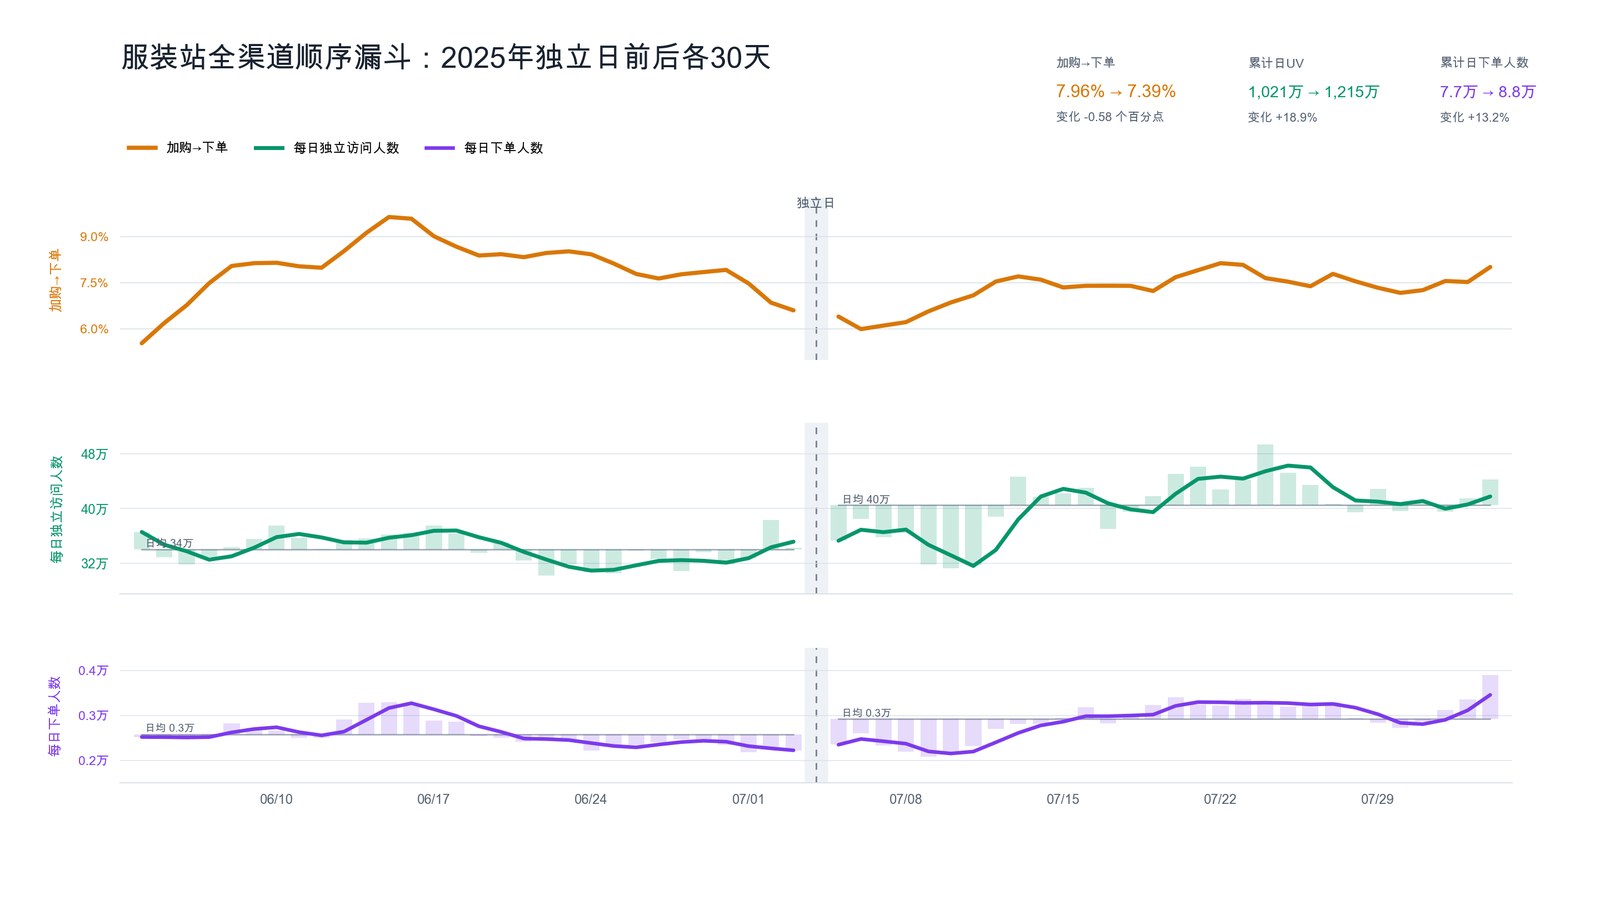
Looking back, the quality of last year's apparently strong market was not as high as it seemed.
Purchasing users rose 13.2% after the holiday, but cart → order fell from 7.96% to 7.39%. Growth in 2025 came from a larger traffic pool, not better closing efficiency.
The first week after the holiday was also a temporary low in 2025, with cart → order falling as far as 6.55%. But traffic rebounded clearly from the second week onward and pulled the total for the full 30-day post-holiday period upward.
Put another way:
- 2025: post-holiday volume rose while back-end efficiency fell; the traffic dividend concealed a conversion problem.
- 2026: post-holiday volume fell while back-end efficiency rose; traffic contraction exposed a front-end problem.
The two years were driven by completely different market dynamics. If you copied the 2025 media calendar in 2026, missing the market was almost inevitable.
Control group: what kind of holiday pattern can be reused?
Does the reversal around Independence Day mean holiday data is useless? Not necessarily. Mother's Day for the same group of stores shows what a stable pattern looks like:
- 2026: in the final week before the holiday, average daily UV rose 14.3% and purchasing users rose 17.7%.
- 2025: over the same period, average daily UV rose 11.0% and purchasing users rose 3.2%.
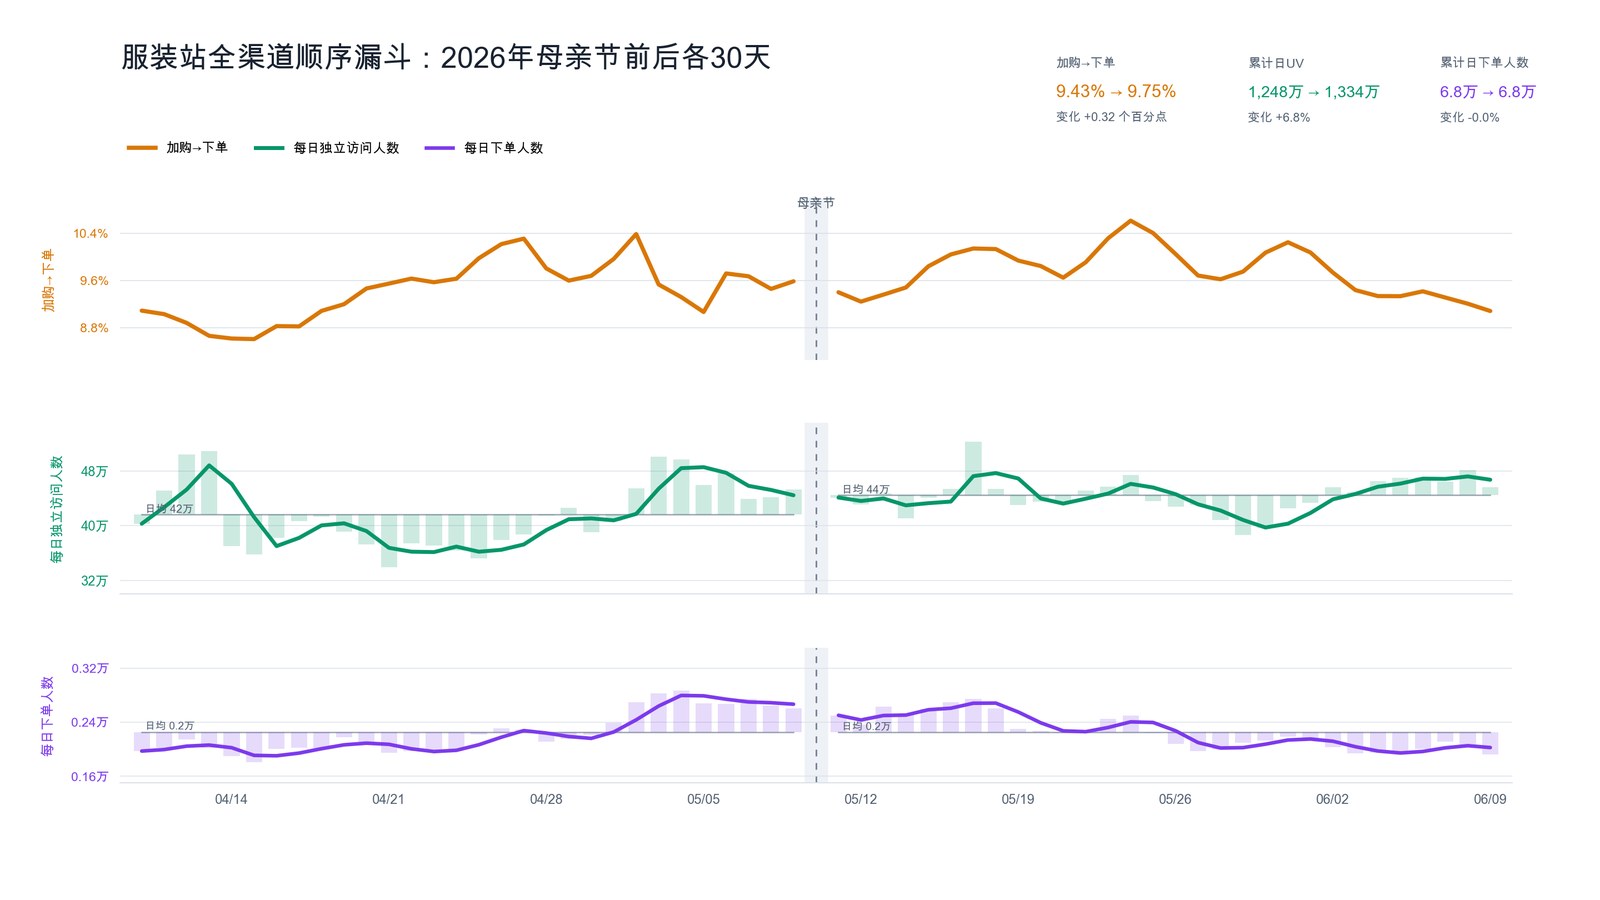
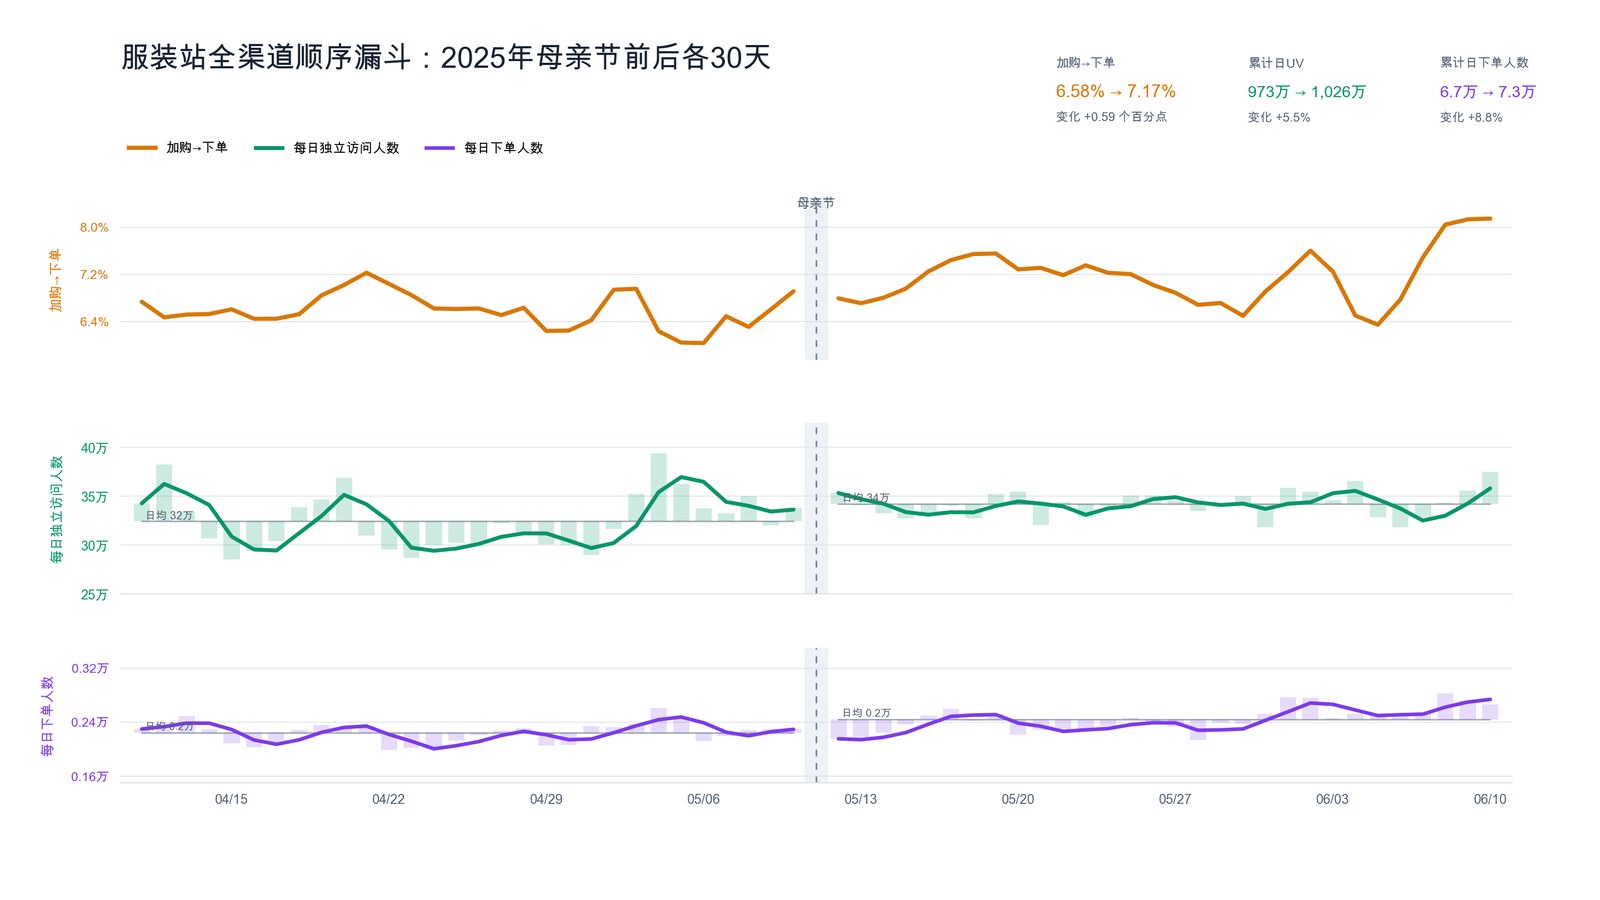
The magnitude differed, but the direction was identical: the volume peak landed in the final week before the holiday in both years. Traffic across the 30 days after the holiday was also higher than before it in both years (+5.5% in 2025 and +6.8% in 2026).
This is where a calendar becomes useful. A holiday with a clear shopping theme, such as Mother's Day, can show a repeatable rhythm that supports advance planning. Independence Day is more tightly linked to vacation schedules. July 4, 2026 fell on a Saturday, so under the U.S. federal holiday schedule, most federal employees observed the holiday on Friday, July 3, creating a long weekend. That kind of holiday needs to be evaluated fresh each year.
Mother's Day still has its own trap. After Mother's Day 2026, traffic was higher and cart → order improved, yet purchasing users were almost flat. The break occurred earlier in the funnel: visit → cart fell from 5.74% to 5.19%. More traffic never automatically means more orders.
Three actions for the second half of 2026 and next year
The useful takeaway is not “Independence Day does not work.” It is a sequence for making decisions.
1. Stop waiting until the holiday itself to read the data. Weakness around Independence Day 2026 appeared two weeks beforehand. Establish the year's baseline three to four weeks in advance. Once the final two weeks begin, track the seven-day trend. If at least two of traffic, add-to-cart rate, and purchasing users weaken, control spend immediately.
2. Identify exactly which stage is failing. Traffic up and add-to-cart rate down → check whether new traffic matches the landing page and products. Add-to-cart rate stable and cart → order down → inspect cart and checkout friction. Cart → order up while traffic and visit conversion remain weak → that is not a recovery; the remaining users are simply more concentrated, so do not scale.
3. Require three signals before scaling again. At least two of traffic, add-to-cart rate, and purchasing users should improve continuously, while visit → order must stop deteriorating. Only then is re-entry reasonably stable. The late Independence Day “recovery,” when only cart → order improved, was a trap rather than a signal.
Final thoughts
Sellers' instincts are often accurate because the bills do not lie. But instinct can only tell you that something feels wrong. Data tells you where it went wrong and when the change began.
The lesson of Independence Day 2026 can be compressed into one sentence: the market started two weeks before the calendar and ended two weeks before it, too.
The calendar defines the window. The funnel defines the action. Let the data determine the next move.